How to Use Graphviz Online: Complete Guide & Practical Cases [2025 Latest]
Abstract: This comprehensive guide explores Graphviz Online, the premier web-based graph visualization tool. Whether you're new to Graphviz Online or looking to master advanced features, this tutorial covers everything from basic Graphviz Online operations to complex diagram creation. Learn how Graphviz Online can transform your data visualization workflow with professional flowcharts, architecture diagrams, and network diagrams using the powerful Graphviz Online platform.
📋 Table of Contents
- What is Graphviz Online?
- Why Choose Graphviz Online?
- Quick Start: Get Started in 5 Minutes
- Basic Features Explained
- Simple Example: Create Your First Flowchart
- Complex Architecture Diagram Case Study
- Frequently Asked Questions
- Summary & Best Practices
What is Graphviz Online?
Graphviz Online is a powerful browser-based graph visualization editor that revolutionizes how we create and render various types of graphs and diagrams. This innovative Graphviz Online platform is built upon the renowned open-source Graphviz software and leverages the DOT language to describe complex graph structures. With Graphviz Online, users can access professional-grade visualization capabilities without any software installation requirements.
The Graphviz Online editor provides an intuitive interface that makes graph creation accessible to both beginners and advanced users. When you use Graphviz Online, you're tapping into decades of graph theory research and optimization algorithms that power the underlying Graphviz engine.
🌟 Key Features of Graphviz Online
- ✅ No Installation Required - Graphviz Online runs directly in your browser, offering cross-platform compatibility
- ✅ Real-time Preview - See visualization results immediately as you modify your Graphviz Online code
- ✅ Multiple Export Formats - Graphviz Online supports PNG, SVG and other formats for seamless export
- ✅ Share & Collaborate - Easy sharing and collaboration through Graphviz Online generated links
- ✅ Professional Output - Graphviz Online generates publication-quality diagrams suitable for technical documentation
🎯 Use Cases for Graphviz Online
- Software Architecture Diagrams: Use Graphviz Online for system design and module relationship diagrams
- Flowcharts: Create business processes and algorithm flow visualizations with Graphviz Online
- Network Topology Diagrams: Design network structure and data flow diagrams using Graphviz Online
- Organizational Charts: Build team structure and hierarchical relationship diagrams in Graphviz Online
- Database Relationship Diagrams: Model table structure and entity relationships with Graphviz Online
Why Choose Graphviz Online?
When evaluating graph visualization tools, Graphviz Online stands out as the premier choice for professionals and enthusiasts alike. The advantages of using Graphviz Online extend far beyond simple diagram creation, offering a comprehensive solution for complex visualization needs.
📊 Comparison: Graphviz Online vs Other Tools
| Feature | Graphviz Online | Mermaid | PlantUML | Draw.io | Visio |
|---|---|---|---|---|---|
| Learning Curve | Medium | Easy | Medium | Easy | Complex |
| Code-driven | ✅ | ✅ | ✅ | ❌ | ❌ |
| Real-time Preview | ✅ | ✅ | ✅ | ✅ | ✅ |
| Complex Graph Support | ⭐⭐⭐⭐⭐ | ⭐⭐⭐ | ⭐⭐⭐⭐ | ⭐⭐⭐⭐⭐ | ⭐⭐⭐⭐⭐ |
| Free to Use | ✅ | ✅ | ✅ | ✅ | ❌ |
| Layout Algorithms | Multiple Professional | Basic | Medium | Manual Layout | Manual Layout |
💡 Top Reasons to Choose Graphviz Online
- Precise Control - Graphviz Online offers precise control of graph layout through code, ensuring predictable and reproducible results
- Professional Output - Generate high-quality professional graphics with Graphviz Online that are suitable for technical documentation and presentations
- Fast Iteration - Make quick adjustments by modifying Graphviz Online code without repetitive manual dragging and positioning
- Automation-friendly - Graphviz Online can be integrated into CI/CD processes for automatic documentation generation and workflow optimization
- Cross-platform Consistency - Get identical rendering results on any device when using Graphviz Online, ensuring consistency across teams
- Advanced Layout Algorithms - Graphviz Online provides access to sophisticated layout algorithms developed over decades of research
- Scalability - Handle large, complex graphs efficiently with Graphviz Online's optimized rendering engine
Quick Start: Get Started with Graphviz Online in 5 Minutes
Getting started with Graphviz Online is remarkably straightforward. This quick-start guide will have you creating your first graph visualization using Graphviz Online in just five minutes. Follow these simple steps to begin your Graphviz Online journey.
Step 1: Access Graphviz Online
- Open your preferred browser and navigate to the official Graphviz Online platform at graphvizonline.net
- No registration required - you can start using Graphviz Online immediately upon page load
- The Graphviz Online interface will load automatically, ready for your first graph creation
Step 2: Familiarize with the Graphviz Online Interface
The Graphviz Online workspace is designed for maximum productivity and ease of use:
Graphviz Online Interface Layout:
┌─────────────────────────────────────────┐
│ Top Toolbar: [Engine Selection] [Export] [Share] │
├──────────────────┬──────────────────────┤
│ Left Code Editor │ Right Graph Preview   │
│ - DOT Language   │ - Real-time Rendering │
│ - Syntax Highlight│ - Zoomable View      │
│ - Error Tips     │ - Interactive Ops    │
└──────────────────┴──────────────────────┘
Step 3: Create Your First Graph with Graphviz Online
- Enter your DOT language code in the left editor panel of Graphviz Online
- Select the appropriate layout engine (typically "dot" for hierarchical graphs) in the Graphviz Online toolbar
- Watch as Graphviz Online renders your graph in real-time in the right preview panel
- Experiment with different Graphviz Online features to customize your visualization
Basic Features Explained
Understanding the core features of Graphviz Online is essential for creating effective visualizations. This section explores the fundamental capabilities that make Graphviz Online such a powerful tool for graph creation and diagram design.
🔧 Core Feature 1: DOT Language Writing in Graphviz Online
Purpose: Master the DOT language syntax within Graphviz Online to describe graph structure and styles effectively
The DOT language is the foundation of all Graphviz Online creations. When working with Graphviz Online, you'll use DOT syntax to define nodes, edges, and styling properties.
Basic Syntax for Graphviz Online:
digraph MyGraph {
    // Graph attributes in Graphviz Online
    rankdir=TB;  // Layout direction: TB(top-bottom), LR(left-right)

    // Node definition for Graphviz Online
    A [label="Node A", shape=box];
    B [label="Node B", shape=ellipse];

    // Edge definition in Graphviz Online
    A -> B [label="connection"];
}
Important Parameters for Graphviz Online:
rankdir: Controls graph layout direction in Graphviz Online (TB, LR, BT, RL)shape: Defines node shape in your Graphviz Online diagram (box, ellipse, diamond, circle, etc.)label: Sets display text for nodes or edges in Graphviz Onlinecolor: Configures color settings for Graphviz Online elementsstyle: Applies style settings in Graphviz Online (filled, dashed, bold, etc.)
🎨 Core Feature 2: Layout Engine Selection in Graphviz Online
Purpose: Choose the optimal layout algorithm in Graphviz Online based on your specific graph type and requirements
Graphviz Online offers multiple layout engines, each optimized for different types of visualizations:
Engine Types Available in Graphviz Online:
- dot: Hierarchical layout in Graphviz Online, perfect for flowcharts and tree structures
- neato: Spring model layout in Graphviz Online, ideal for undirected graphs
- fdp: Force-directed layout in Graphviz Online, suitable for large, complex graphs
- circo: Circular layout in Graphviz Online, excellent for circular relationship structures
- twopi: Radial layout in Graphviz Online, perfect for center-radial structures
Important Notes for Graphviz Online Users:
- ⚠️ Different Graphviz Online engines are optimized for specific graph types
- ⚠️ Complex graphs in Graphviz Online may require testing multiple engines to achieve optimal results
- ⚠️ Engine selection in Graphviz Online significantly impacts the final visual presentation and clarity
Simple Example: Create Your First Flowchart
🎯 Project Goal
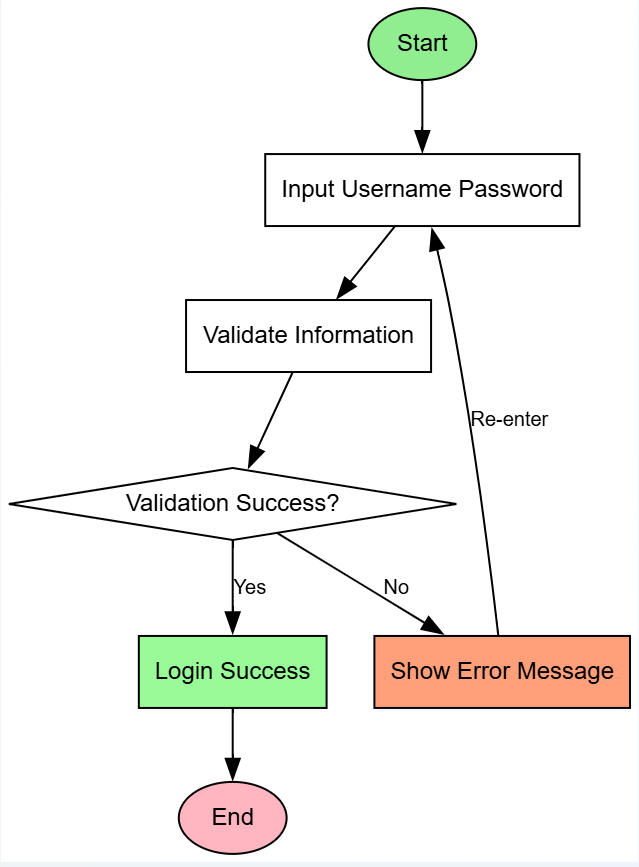
Create a simple user login flowchart to help you understand basic operation processes.
📝 Specific Steps
Step 1: Project Setup
digraph LoginFlow {
    // Basic settings
    rankdir=TB;
    bgcolor="white";
    node [fontname="Arial", fontsize=12];
    edge [fontname="Arial", fontsize=10];
}
Step 2: Add Basic Elements
- Add start and end nodes
start [label="Start", shape=ellipse, style=filled, fillcolor="#90EE90"];
end [label="End", shape=ellipse, style=filled, fillcolor="#FFB6C1"];
- Add processing steps
input [label="Input Username Password", shape=box];
validate [label="Validate Information", shape=box];
decision [label="Validation Success?", shape=diamond];
success [label="Login Success", shape=box, style=filled, fillcolor="#98FB98"];
error [label="Show Error Message", shape=box, style=filled, fillcolor="#FFA07A"];
Step 3: Connect Nodes
start -> input;
input -> validate;
validate -> decision;
decision -> success [label="Yes"];
decision -> error [label="No"];
error -> input [label="Re-enter"];
success -> end;
🎉 Complete Code
digraph LoginFlow {
    rankdir=TB;
    bgcolor="white";
    node [fontname="Arial", fontsize=12];
    edge [fontname="Arial", fontsize=10];

    start [label="Start", shape=ellipse, style=filled, fillcolor="#90EE90"];
    input [label="Input Username Password", shape=box];
    validate [label="Validate Information", shape=box];
    decision [label="Validation Success?", shape=diamond];
    success [label="Login Success", shape=box, style=filled, fillcolor="#98FB98"];
    error [label="Show Error Message", shape=box, style=filled, fillcolor="#FFA07A"];
    end [label="End", shape=ellipse, style=filled, fillcolor="#FFB6C1"];

    start -> input;
    input -> validate;
    validate -> decision;
    decision -> success [label="Yes"];
    decision -> error [label="No"];
    error -> input [label="Re-enter"];
    success -> end;
}
🎉 Result Preview
Complex Architecture Diagram Case Study
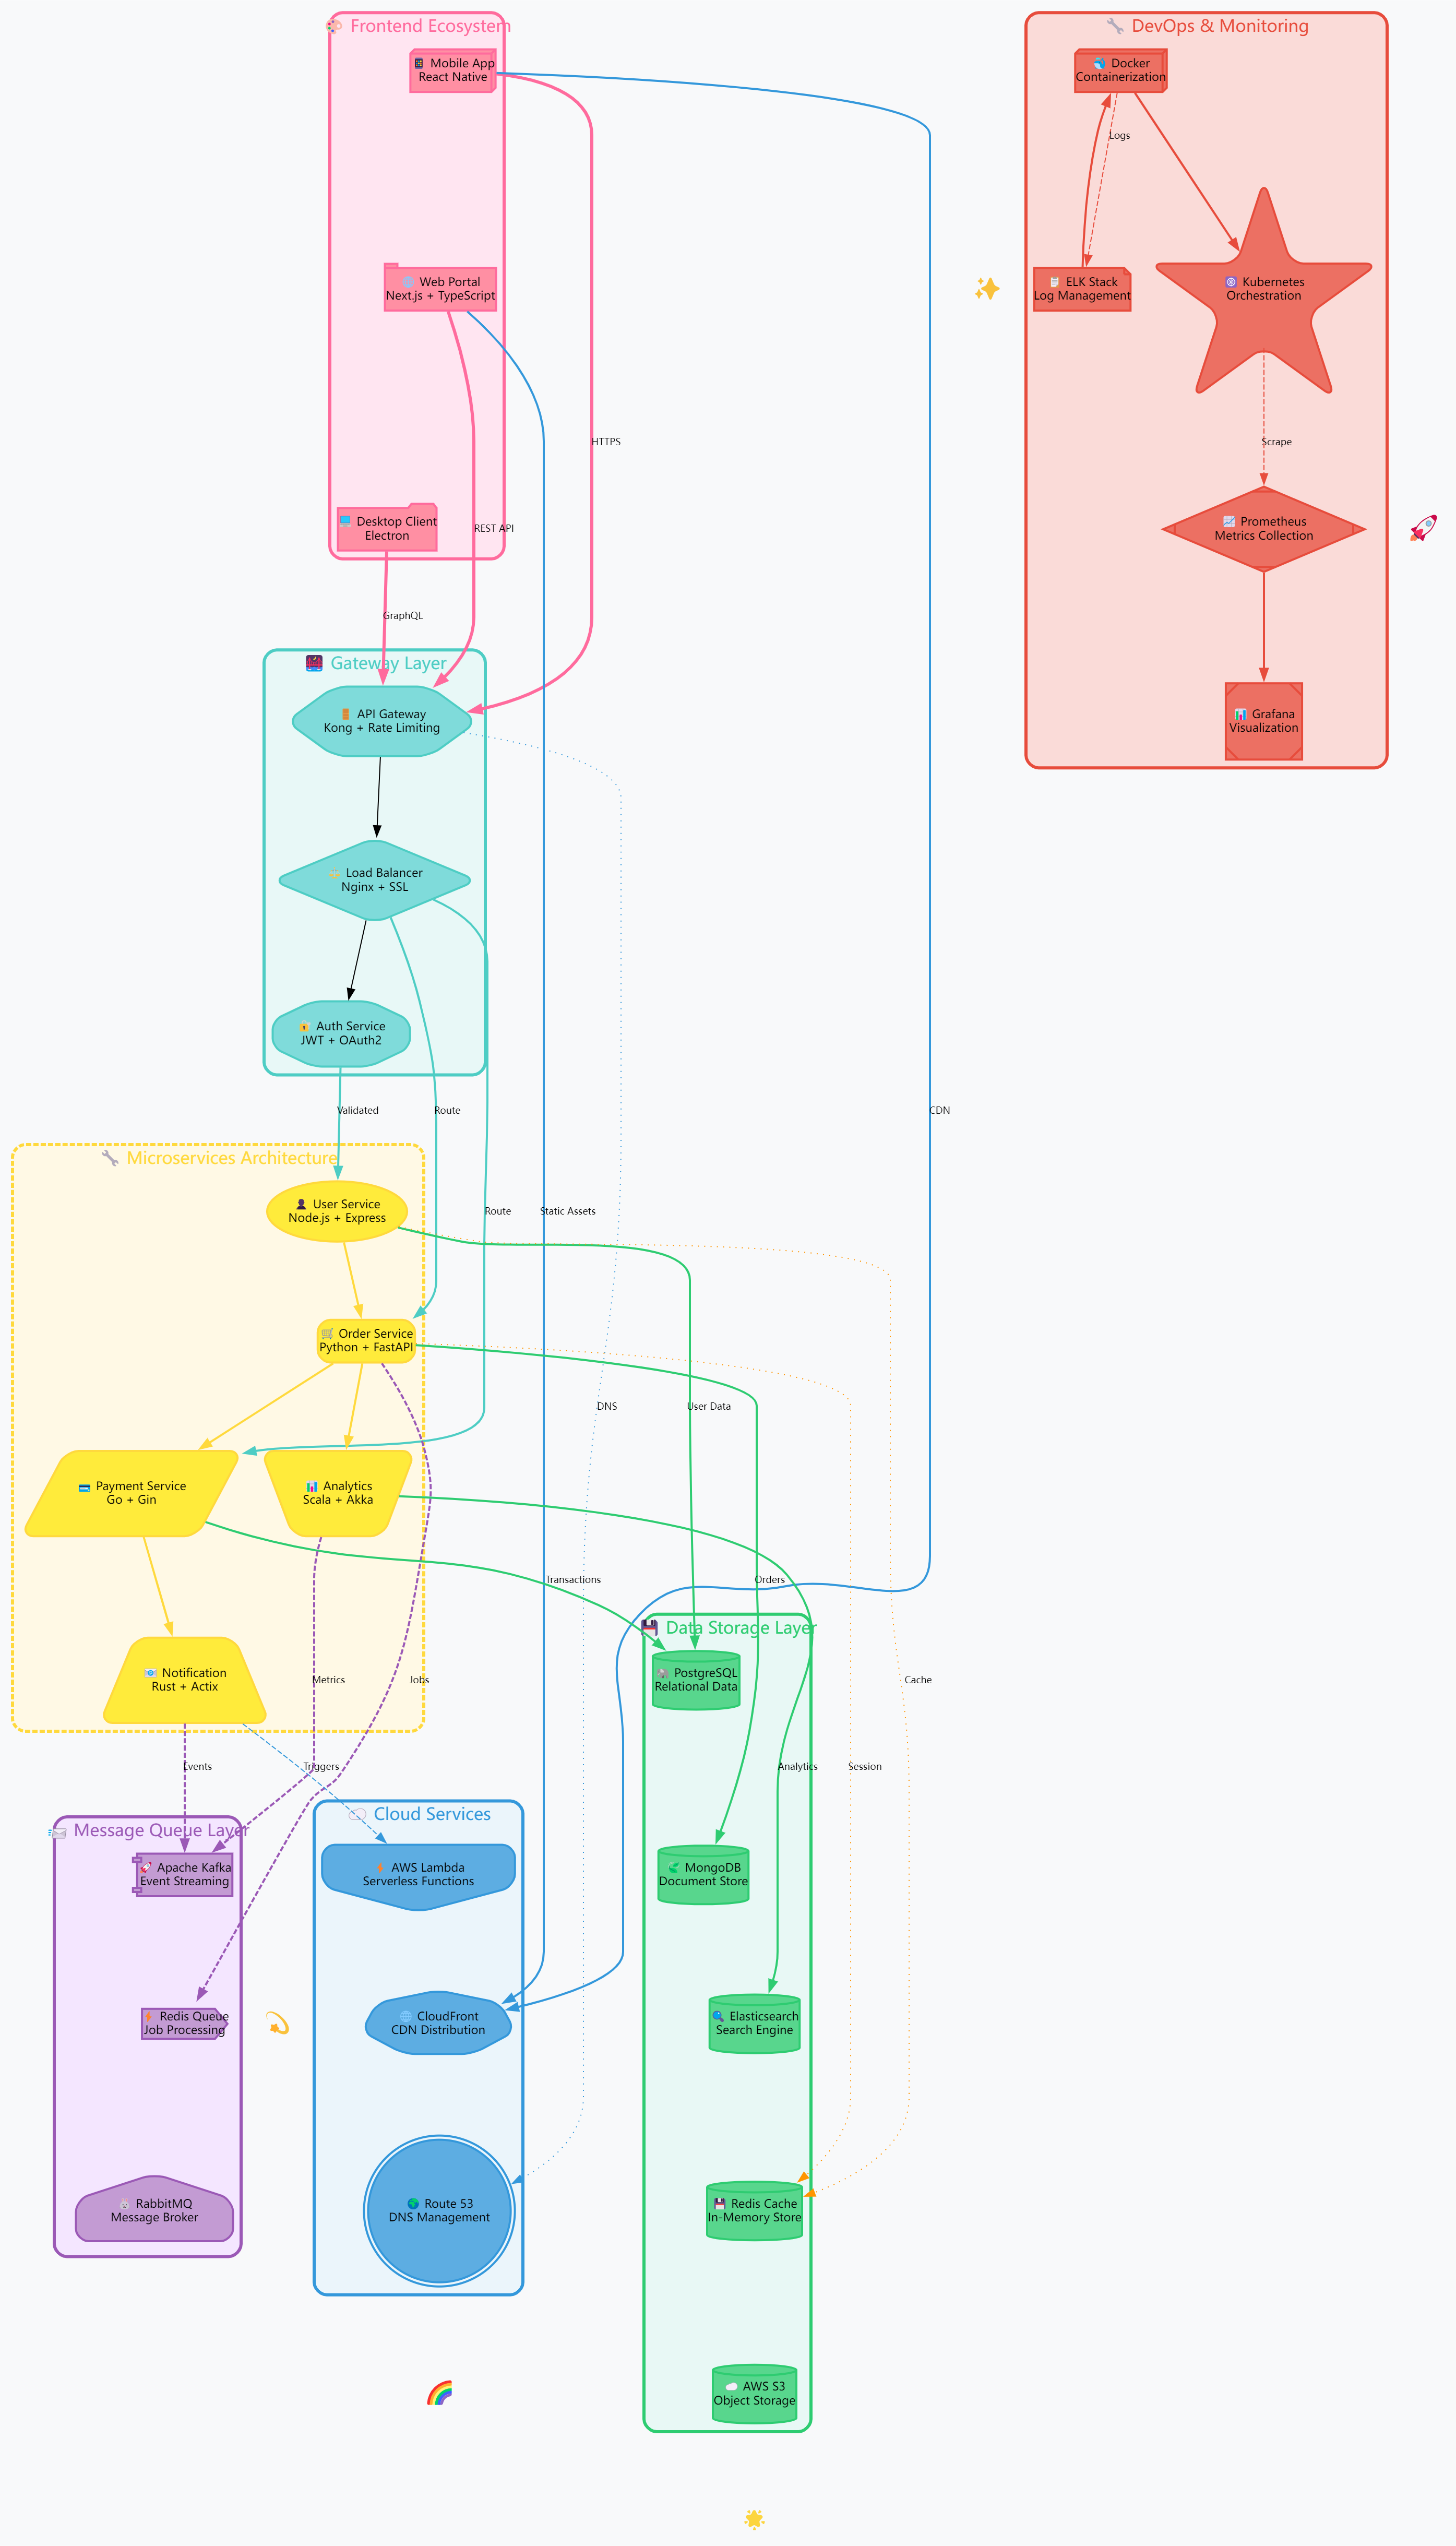
Below shows a complete architecture diagram of a modern technology stack, including multiple layers such as frontend, backend, database, monitoring, etc.:
digraph ModernTechStack {
    rankdir=TB;
    bgcolor="#F8F9FA";
    compound=true;

    // 全局样式设置
    node [fontname="SF Pro Display", fontsize=11, margin=0.1];
    edge [fontname="SF Pro Display", fontsize=9, minlen=2];

    // 用户交互层
    subgraph cluster_frontend {
        style="filled,rounded";
        color="#FF6B9D";
        fillcolor="#FFE5F1";
        penwidth=3;

        node [style="filled,rounded,shadow", fillcolor="#FF8FA3", color="#FF6B9D", penwidth=2];

        mobile [label="📱 Mobile App\nReact Native", shape=box3d];
        web [label="🌐 Web Portal\nNext.js + TypeScript", shape=tab];
        desktop [label="💻 Desktop Client\nElectron", shape=folder];

        mobile -> web [style=invis];
        web -> desktop [style=invis];

        label="🎨 Frontend Ecosystem";
        fontcolor="#FF6B9D";
        fontsize=16;
        fontname="SF Pro Display Bold";
    }

    // API网关层
    subgraph cluster_gateway {
        style="filled,rounded";
        color="#4ECDC4";
        fillcolor="#E8F8F7";
        penwidth=3;

        node [style="filled,rounded,shadow", fillcolor="#7FDBDA", color="#4ECDC4", penwidth=2];

        api_gateway [label="🚪 API Gateway\nKong + Rate Limiting", shape=hexagon];
        load_balancer [label="⚖️ Load Balancer\nNginx + SSL", shape=diamond];
        auth_service [label="🔐 Auth Service\nJWT + OAuth2", shape=octagon];

        api_gateway -> load_balancer -> auth_service;

        label="🌉 Gateway Layer";
        fontcolor="#4ECDC4";
        fontsize=16;
        fontname="SF Pro Display Bold";
    }

    // 微服务层
    subgraph cluster_microservices {
        style="filled,rounded,dashed";
        color="#FFD93D";
        fillcolor="#FFF9E5";
        penwidth=3;

        node [style="filled,rounded,shadow", fillcolor="#FFEB3B", color="#FFD93D", penwidth=2];

        user_service [label="👤 User Service\nNode.js + Express", shape=ellipse];
        order_service [label="🛒 Order Service\nPython + FastAPI", shape=box];
        payment_service [label="💳 Payment Service\nGo + Gin", shape=parallelogram];
        notification_service [label="📧 Notification\nRust + Actix", shape=trapezium];
        analytics_service [label="📊 Analytics\nScala + Akka", shape=invtrapezium];

        // 服务间连接
        user_service -> order_service [color="#FFD93D", penwidth=2];
        order_service -> payment_service [color="#FFD93D", penwidth=2];
        payment_service -> notification_service [color="#FFD93D", penwidth=2];
        order_service -> analytics_service [color="#FFD93D", penwidth=2];

        label="🔧 Microservices Architecture";
        fontcolor="#FFD93D";
        fontsize=16;
        fontname="SF Pro Display Bold";
    }

    // 消息队列层
    subgraph cluster_messaging {
        style="filled,rounded";
        color="#9B59B6";
        fillcolor="#F4E6FF";
        penwidth=3;

        node [style="filled,rounded,shadow", fillcolor="#C39BD3", color="#9B59B6", penwidth=2];

        kafka [label="🚀 Apache Kafka\nEvent Streaming", shape=component];
        redis_queue [label="⚡ Redis Queue\nJob Processing", shape=cds];
        rabbitmq [label="🐰 RabbitMQ\nMessage Broker", shape=house];

        kafka -> redis_queue [style=invis];
        redis_queue -> rabbitmq [style=invis];

        label="📨 Message Queue Layer";
        fontcolor="#9B59B6";
        fontsize=16;
        fontname="SF Pro Display Bold";
    }

    // 数据存储层
    subgraph cluster_storage {
        style="filled,rounded";
        color="#2ECC71";
        fillcolor="#E8F8F5";
        penwidth=3;

        node [style="filled,rounded,shadow", fillcolor="#58D68D", color="#2ECC71", penwidth=2];

        postgres [label="🐘 PostgreSQL\nRelational Data", shape=cylinder];
        mongodb [label="🍃 MongoDB\nDocument Store", shape=cylinder];
        elasticsearch [label="🔍 Elasticsearch\nSearch Engine", shape=cylinder];
        redis_cache [label="💾 Redis Cache\nIn-Memory Store", shape=cylinder];
        s3_storage [label="☁️ AWS S3\nObject Storage", shape=cylinder];

        // 数据库连接
        postgres -> mongodb [style=invis];
        mongodb -> elasticsearch [style=invis];
        elasticsearch -> redis_cache [style=invis];
        redis_cache -> s3_storage [style=invis];

        label="💾 Data Storage Layer";
        fontcolor="#2ECC71";
        fontsize=16;
        fontname="SF Pro Display Bold";
    }

    // 监控和运维层
    subgraph cluster_devops {
        style="filled,rounded";
        color="#E74C3C";
        fillcolor="#FADBD8";
        penwidth=3;

        node [style="filled,rounded,shadow", fillcolor="#EC7063", color="#E74C3C", penwidth=2];

        prometheus [label="📈 Prometheus\nMetrics Collection", shape=Mdiamond];
        grafana [label="📊 Grafana\nVisualization", shape=Msquare];
        elk_stack [label="📋 ELK Stack\nLog Management", shape=note];
        docker [label="🐳 Docker\nContainerization", shape=box3d];
        kubernetes [label="☸️ Kubernetes\nOrchestration", shape=star];

        prometheus -> grafana [color="#E74C3C", penwidth=2];
        elk_stack -> docker [color="#E74C3C", penwidth=2];
        docker -> kubernetes [color="#E74C3C", penwidth=2];

        label="🔧 DevOps & Monitoring";
        fontcolor="#E74C3C";
        fontsize=16;
        fontname="SF Pro Display Bold";
    }

    // 云服务层
    subgraph cluster_cloud {
        style="filled,rounded";
        color="#3498DB";
        fillcolor="#EBF5FB";
        penwidth=3;

        node [style="filled,rounded,shadow", fillcolor="#5DADE2", color="#3498DB", penwidth=2];

        aws_lambda [label="⚡ AWS Lambda\nServerless Functions", shape=invhouse];
        cloudfront [label="🌐 CloudFront\nCDN Distribution", shape=septagon];
        route53 [label="🌍 Route 53\nDNS Management", shape=doublecircle];

        aws_lambda -> cloudfront [style=invis];
        cloudfront -> route53 [style=invis];

        label="☁️ Cloud Services";
        fontcolor="#3498DB";
        fontsize=16;
        fontname="SF Pro Display Bold";
    }

    // 主要连接关系
    mobile -> api_gateway [label="HTTPS", color="#FF6B9D", penwidth=3, style=bold];
    web -> api_gateway [label="REST API", color="#FF6B9D", penwidth=3, style=bold];
    desktop -> api_gateway [label="GraphQL", color="#FF6B9D", penwidth=3, style=bold];

    auth_service -> user_service [label="Validated", color="#4ECDC4", penwidth=2];
    load_balancer -> order_service [label="Route", color="#4ECDC4", penwidth=2];
    load_balancer -> payment_service [label="Route", color="#4ECDC4", penwidth=2];

    // 微服务到消息队列
    notification_service -> kafka [label="Events", color="#9B59B6", penwidth=2, style=dashed];
    analytics_service -> kafka [label="Metrics", color="#9B59B6", penwidth=2, style=dashed];
    order_service -> redis_queue [label="Jobs", color="#9B59B6", penwidth=2, style=dashed];

    // 微服务到数据库
    user_service -> postgres [label="User Data", color="#2ECC71", penwidth=2];
    order_service -> mongodb [label="Orders", color="#2ECC71", penwidth=2];
    payment_service -> postgres [label="Transactions", color="#2ECC71", penwidth=2];
    analytics_service -> elasticsearch [label="Analytics", color="#2ECC71", penwidth=2];

    // 缓存连接
    user_service -> redis_cache [label="Cache", color="#FF9500", penwidth=1, style=dotted];
    order_service -> redis_cache [label="Session", color="#FF9500", penwidth=1, style=dotted];

    // 监控连接
    kubernetes -> prometheus [label="Scrape", color="#E74C3C", penwidth=1, style=dashed];
    docker -> elk_stack [label="Logs", color="#E74C3C", penwidth=1, style=dashed];

    // 云服务连接
    web -> cloudfront [label="Static Assets", color="#3498DB", penwidth=2];
    mobile -> cloudfront [label="CDN", color="#3498DB", penwidth=2];
    api_gateway -> route53 [label="DNS", color="#3498DB", penwidth=1, style=dotted];
    notification_service -> aws_lambda [label="Triggers", color="#3498DB", penwidth=1, style=dashed];

    // 装饰性元素
    sparkle1 [label="✨", shape=plaintext, fontsize=24, fontcolor="#FFD700"];
    sparkle2 [label="🌟", shape=plaintext, fontsize=20, fontcolor="#FF69B4"];
    sparkle3 [label="💫", shape=plaintext, fontsize=22, fontcolor="#00CED1"];
    rocket [label="🚀", shape=plaintext, fontsize=26, fontcolor="#FF6347"];
    rainbow [label="🌈", shape=plaintext, fontsize=24, fontcolor="#FF1493"];

    // 隐形连接用于定位装饰元素
    mobile -> sparkle1 [style=invis];
    kubernetes -> rocket [style=invis];
    s3_storage -> sparkle2 [style=invis];
    kafka -> sparkle3 [style=invis];
    route53 -> rainbow [style=invis];
}
🎉 Result Preview
View Complete Example On Graphviz Online
Key Technical Points:
- Use subgraphs for modular grouping
- Use different colors to distinguish different layers
- Properly use node shapes to express different component types
- Use line styles to represent different types of relationships
Frequently Asked Questions
❓ Question 1: Graph displays incompletely or layout is messy
Problem Description: Generated graph has overlapping nodes or too many crossing connections
Solutions:
- Try different layout engines (dot, neato, fdp)
- Adjust
rankdirparameter to change layout direction - Use
nodesepandranksepto adjust node spacing
❓ Question 2: Chinese characters display abnormally
Problem Description: Chinese text displays as garbled characters or boxes in the graph
Solutions:
digraph G {
    // Set font to support Chinese
    node [fontname="SimHei"];  // Windows
    edge [fontname="SimHei"];

    // Or use
    node [fontname="Arial Unicode MS"];  // Cross-platform
}
❓ Question 3: Exported image quality is poor
Problem Description: Exported PNG images are blurry or have insufficient resolution
Solutions:
- Prioritize SVG format export (vector graphics, lossless scaling)
- If PNG is needed, enlarge preview window before export
- Use
dpiparameter to improve output resolution
Summary & Best Practices
📚 Learning Points Review
Through this tutorial, you have learned:
- ✅ Basic concepts and uses of Graphviz Online
- ✅ Creating simple flowcharts from scratch
- ✅ Mastering core syntax of DOT language
- ✅ Solving design challenges of complex architecture diagrams
- ✅ Troubleshooting and solving common problems
🌟 Best Practice Recommendations
- Code Organization: Use comments and indentation to keep code clear for future maintenance
- Style Consistency: Define global styles to ensure visual consistency of graphs
- Layered Design: Properly use subgraph functionality to organize complex graphs in layers
- Version Control: Include DOT code in version control for team collaboration
📈 Advanced Learning Path
- Beginner Level: Master basic syntax, able to create simple flowcharts and architecture diagrams
- Intermediate Level: Learn to use subgraphs, style customization, and multiple layout engines
- Advanced Level: Able to design complex system architecture diagrams and integrate into automation processes
🔗 Related Resources
- Graphviz Official Documentation
- DOT Language Complete Syntax Reference
- Graphviz Online Editor
- More Graph Style Examples
Start your visualization journey! 🚀