audioFlux
audioFlux是一个用于音频和音乐分析、特征提取的库,支持多种时频分析变换方法和数百种特征组合,适用于深度学习训练和音频领域的各种任务研究。
• Copy the embed code to showcase this product on your website
• Share on X to spread the word about this amazing tool
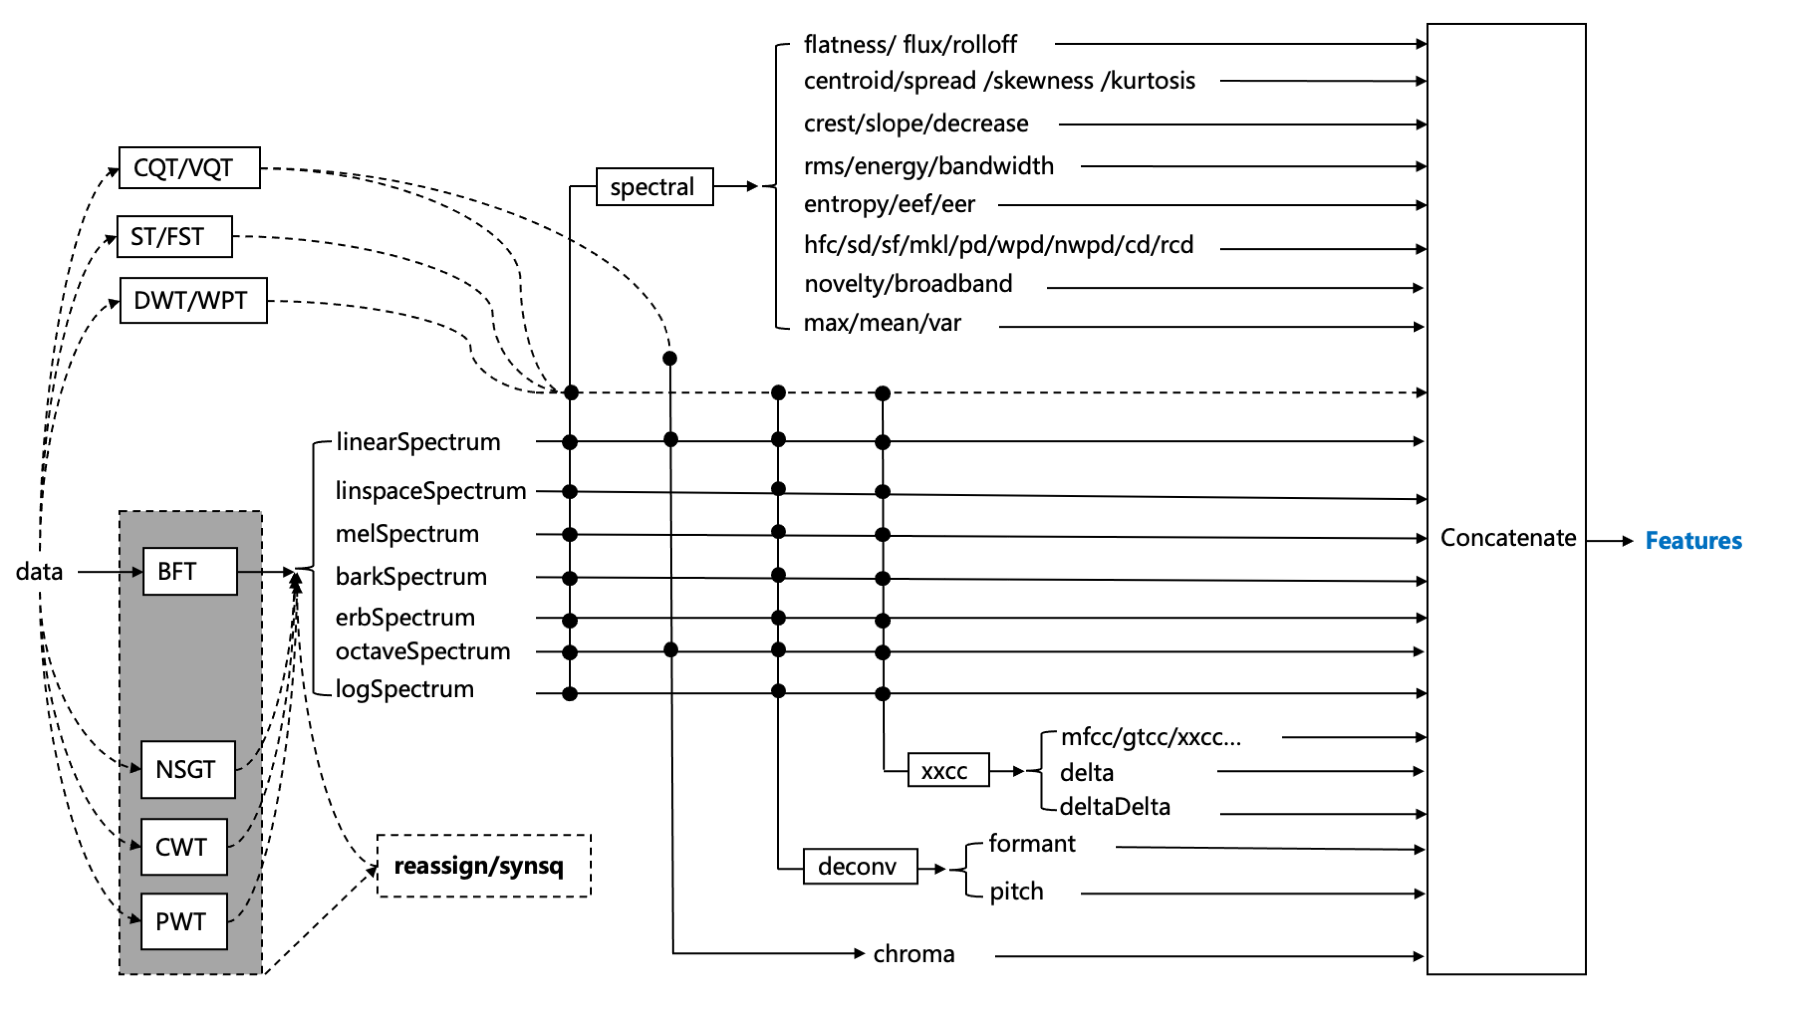
- 项目地址:https://github.com/libAudioFlux/audioFlux- 类别:C、Python- 项目标题:A library for audio and music analysis, feature extraction.- 项目描述:一个用于音频和音乐分析、特征提取的库,支持数十种时频分析变换方法,以及相应时域、频域数百种特征组合,可以提供给深度学习网络进行训练,用于研究音频领域的分类、分离、音乐信息检索(MIR)、ASR等各种任务。- 亮点:> 1. 系统、多维度的提取特征和组合,可以灵活的用于各种任务研究分析。> 2. 性能高效,核心大部分C实现,基于不同平台FFT硬件加速,方便大规模数据特征提取。> 3. 适用移动端,支持移动端音频流实时计算。
 - 示例代码:官方文档
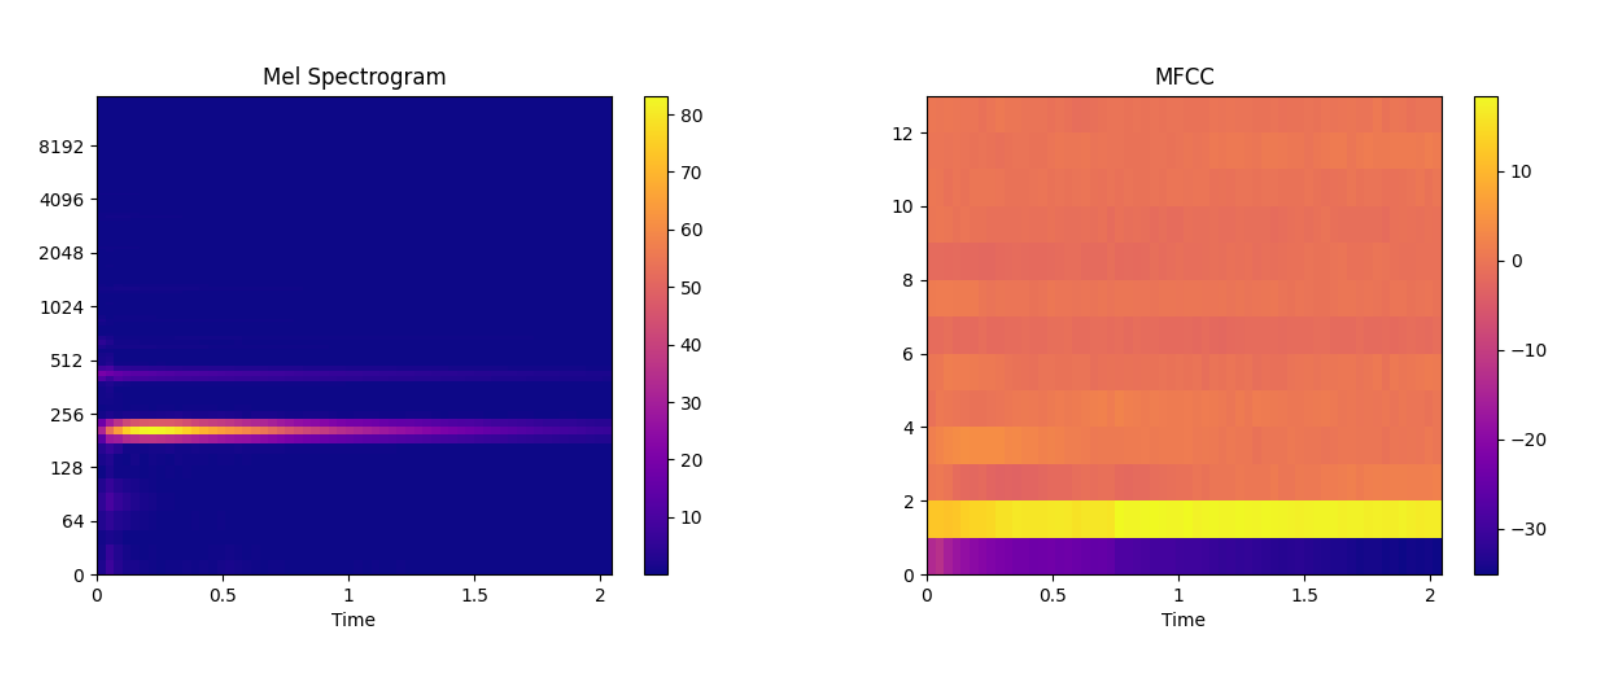
 bash pip install audioflux ``````pythonimport numpy as npimport audioflux as afimport matplotlib.pyplot as pltfrom audioflux.display import fill_spec# Get a 220Hz's audio file pathsample_path = af.utils.sample_path('220')# Read audio data and sample rateaudio_arr, sr = af.read(sample_path)# Extract mel spectrogramspec_arr, mel_fre_band_arr = af.mel_spectrogram(audio_arr, num=128, radix2_exp=12, samplate=sr)spec_arr = np.abs(spec_arr)# Extract mfccmfcc_arr, _ = af.mfcc(audio_arr, cc_num=13, mel_num=128, radix2_exp=12, samplate=sr)# Displayaudio_len = audio_arr.shape[0]# calculate x/y-coordsx_coords = np.linspace(0, audio_len / sr, spec_arr.shape[1] + 1)y_coords = np.insert(mel_fre_band_arr, 0, 0)fig, ax = plt.subplots()img = fill_spec(spec_arr, axes=ax, x_coords=x_coords, y_coords=y_coords, x_axis='time', y_axis='log', title='Mel Spectrogram')fig.colorbar(img, ax=ax)fig, ax = plt.subplots()img = fill_spec(mfcc_arr, axes=ax, x_coords=x_coords, x_axis='time', title='MFCC')fig.colorbar(img, ax=ax)plt.show()