PyGWalker
PyGWalker是一个在Jupyter Notebook环境中运行的可视化探索式分析工具,通过一行代码将数据集转化为可交互的可视化界面,支持类似Tableau/PowerBI的拖拽式数据分析,大幅降低数据可视化分析的时间成本。
• Copy the embed code to showcase this product on your website
• Share on X to spread the word about this amazing tool
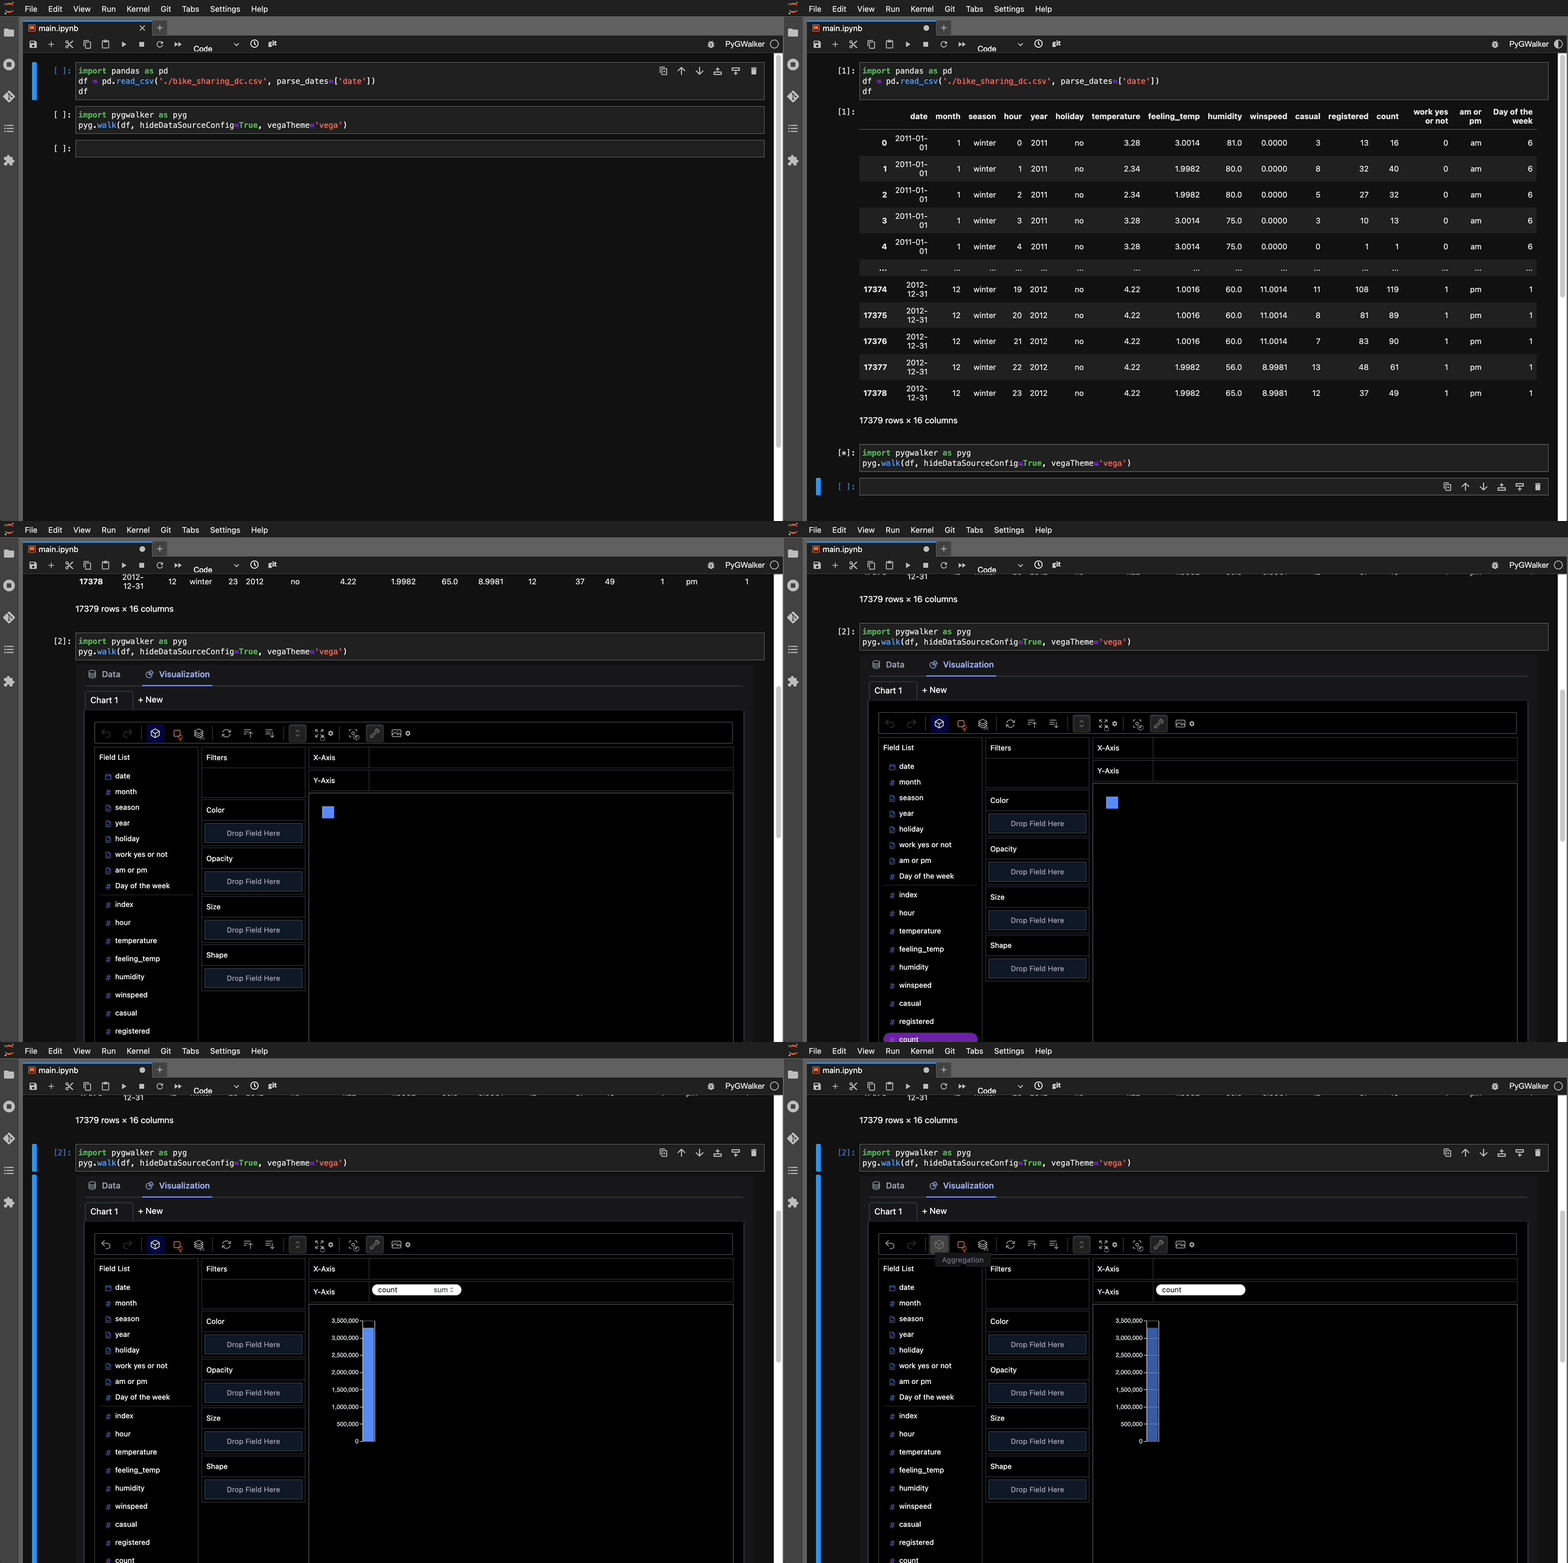
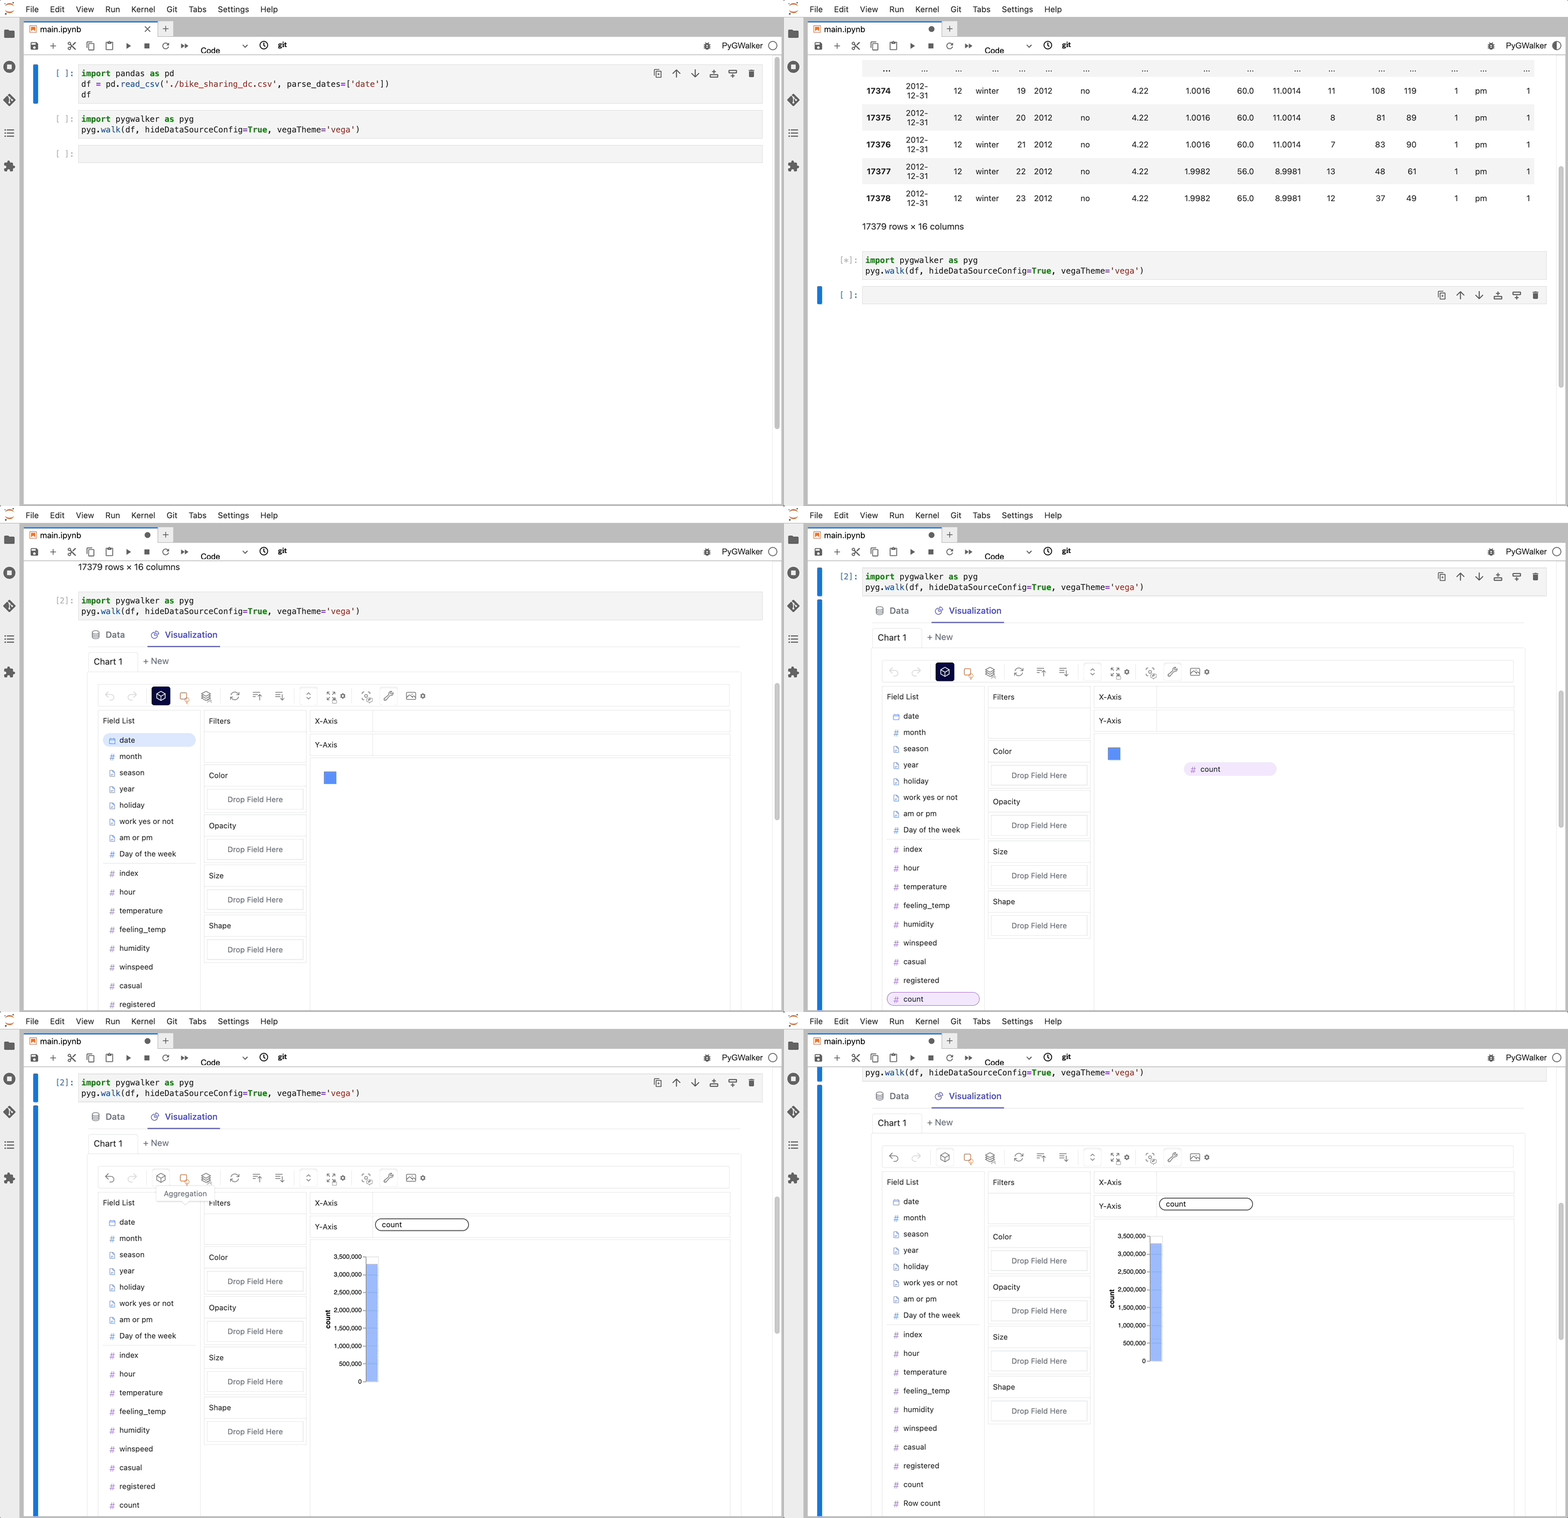
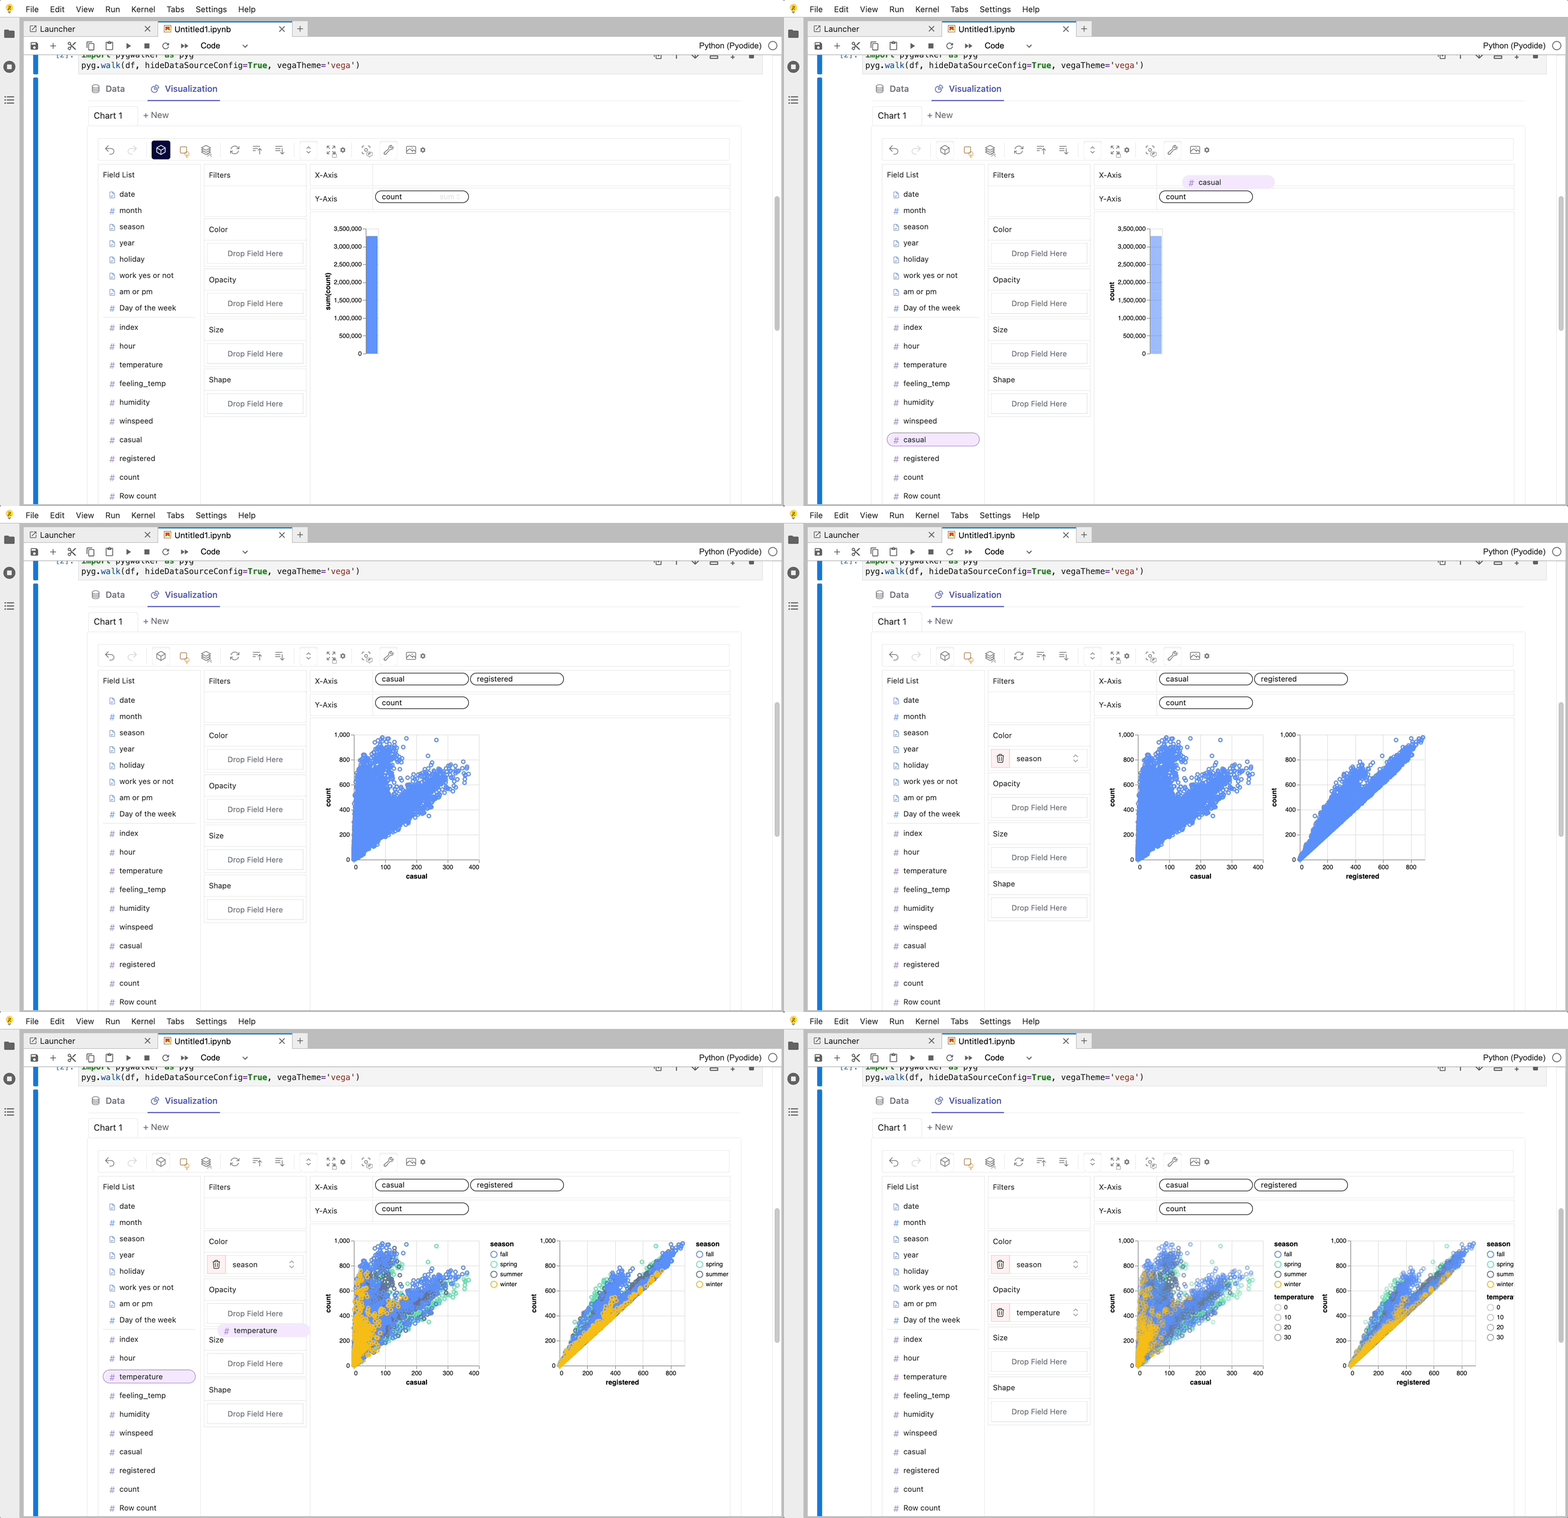
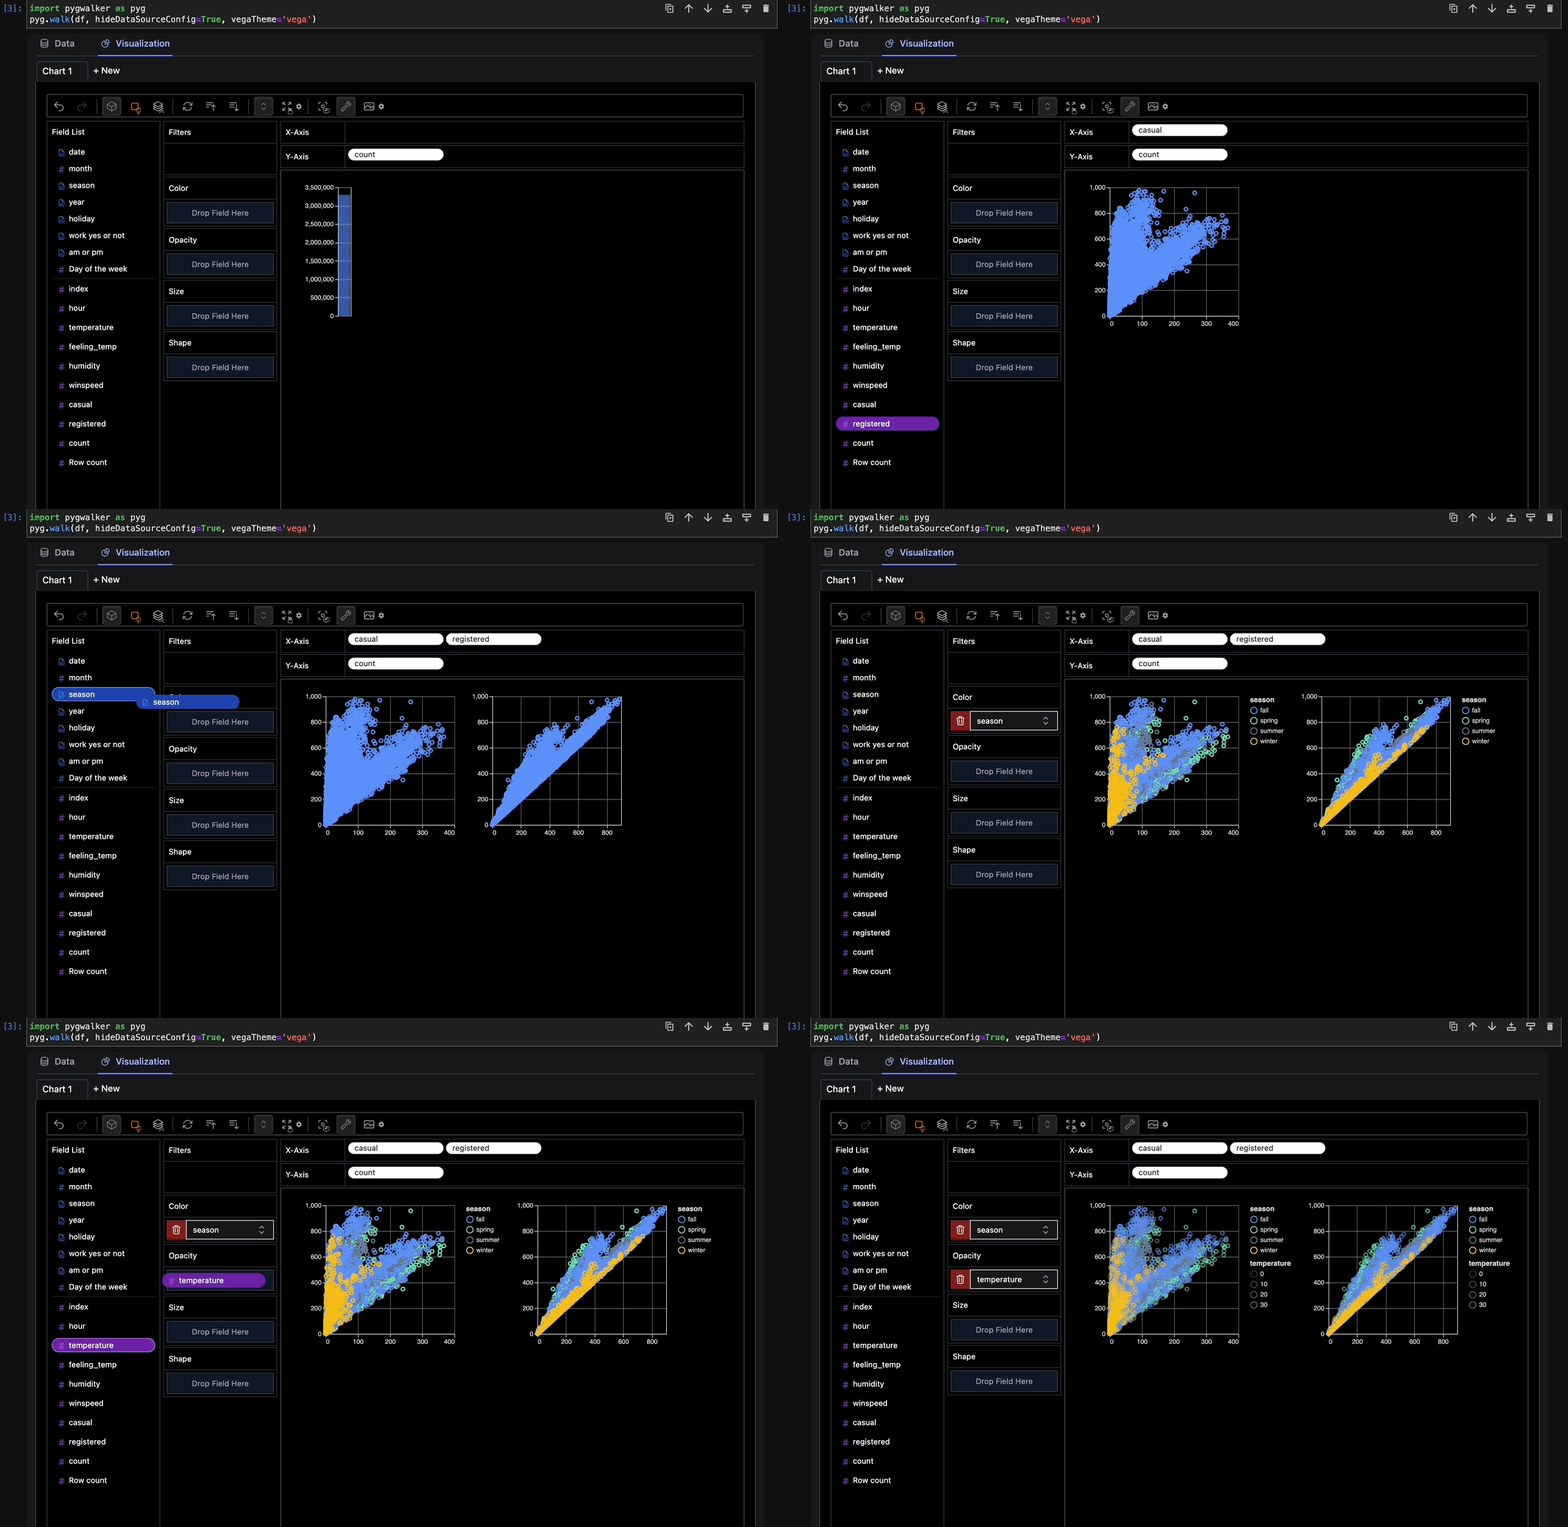
 ## 项目说明PyGWalker是个在Jupyter Notebook环境中运行的可视化探索式分析工具,仅一条命令即可生成一个可交互的图形界面,以类似Tableau/PowerBI的方式,通过拖拽字段进行数据分析。过去在python中进行数据可视化分析时,经常需要查询大量的可视化类的代码,并编写胶水代码将其应用在数据集上。PyGWalker的目标是通过一行代码,将数据集转化为一个可视化分析工具,只需拖拉拽即可生成图表,从而减少数据分析师在数据可视化上的时间成本。项目地址:https://github.com/Kanaries/pygwalker或直接在[Google Colab](https://colab.research.google.com/drive/171QUQeq-uTLgSj1u-P9DQig7Md1kpXQ2?usp=sharing), Kaggle Code或者
上试用。假设你有一个pandas DataFrame,那么你只需
python!pip install pygwalkerimport pygwalker as pygpyg.walk(df)即可开始数据探索:<!-- [](https://github.com/Kanaries/pygwalker) -->将dataframe转化为可交互的可视化分析工具 只需拖拉拽即可生成复杂图表,无需编写代码。
 <!-- [](https://github.com/Kanaries/pygwalker) --><!-- [](https://github.com/Kanaries/pygwalker) --><!-- [](https://github.com/Kanaries/pygwalker) -->
<!-- [](https://github.com/Kanaries/pygwalker) --><!-- [](https://github.com/Kanaries/pygwalker) --><!-- [](https://github.com/Kanaries/pygwalker) -->
 ## 已测试的环境pygwalker可以在数据科学家日常工作中使用的大部分环境下运行,包括:- Jupyter Notebook- Jupyter Lite- Google Colab- Kaggle Code- Jupyter Lab (WIP: 仍然存在一些关于react-beautiful-dnd的CSS bug)- Databricks Notebook (自
0.1.4a0版本后支持)- VSCode中的Jupyter扩展 (自0.1.4a1版本后支持)- Hex Project- Streamlit- Streamlit, (自 0.1.4.9版本后支持)- DataCamp Workspace (自0.1.4a0版本后支持)- 大多数支持IPython Kernel的在线Notebook平台更多运行环境欢迎补充项目地址:https://github.com/Kanaries/pygwalker